Professor Rachel Norman and Dr Andy Hoyle, Faculty of Natural Sciences, University of Stirling
In the second of a two part lecture on COVID-19 and mathematical modelling, Professor Rachel Norman and Dr Andy Hoyle explore the theory behind the “R” number, what’s this means, and the role that super spreaders and herd immunity play in managing epidemics.
Watch the lecture online here or read the transcript below.
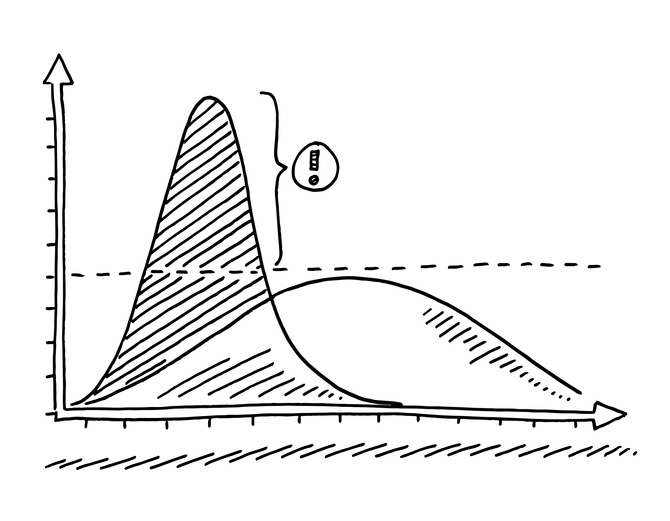
Hello, my name’s Rachel Norman and I work in the computer science and maths department at the University of Stirling. This is the talk that I’ve written with my colleague Andy Hoyle. We’re both mathematical biologists, this is our research area. We’ve already done a bite-sized lecture on simple mathematical models and COVID-19, which talked about the flattening of the curve. This one’s a follow up that looks at herd immunity, the R number and COVID-19.
I’ll first introduce the idea of the basic reproductive number and then we’ll look at how that relates to COVID, and you’ll have seen this is all over the news. So, just for those who have missed the first lecture or just want a bit of a reminder, this one slide here to look at a simple model of disease spread. What we do is we split the whole population, for the kind of disease we’re talking about, where we’ve got direct transmission from person to person of a virus or bacteria. We split the whole population into those who are susceptible to disease (so they haven’t had it, they haven’t got it currently, but they could get it), those who are infected and infectious (so they’re currently transmitting) and those who are recovered and immune. To move between those groups, for you to become infected, then there needs to be a new infection and then you recover and move into the immune group. We look at how those numbers change over time. The main thing is we’ve got two basic things going on here. We’re looking at transmission, that’s a new infection and recovery. Those are the only two elements that go into these very simple models.
R naught
The basic reproduction number, “R naught” – I’m going to insist on giving it its full name just for now – is the R number people have talked about. It’s defined as the number of new infections caused by one infected individual entering an entirely susceptible population. If that number small, if it’s less than one, then the infection will die out. You’ll get one or two, a small number of infections, and then there just won’t be any onward transmission or not enough onward transmission to cause a big outbreak. Whereas if R naught is greater than one, the infection will spread and you’ll get an outbreak and epidemic as we’ve seen with COVID.
To calculate this basic reproduction number for one infected individual, it’s about the number of people you infect per day and the number of days you’re infected for. So, the longer you’re infected, the more people you’re likely to infect and the more infectious you are, the more virus shedding or the more contacts you make, then that increase the number of people who you infect, per day. So, those are the two things you need to take into account. Those are basically the two things I just talked about in the model, the transmission rates and the length of time you’re infected for: your recovery rate.
For particular diseases, we’ve got this R naught that comes from data or from the models. So, things like measles have got a really high reproduction number and for things like Ebola, it’s a bit smaller, but they’re all bigger than one. As you’ll see and what we’ve seen is for COVID-19, it’s approximately three. There’s some debate over this and it depends on what data you’re looking at. But roughly, we can say it’s three. You’ll have seen this diagram and you see that if the left one person infects three people and then they infect three more, you can see very quickly you get the large numbers. What we’ve talked about in terms of controlling the disease, if you stop some onward transmission, you can greatly reduce the number of new infections in the future by staying at home or not flying or not going to a barbecue, for example. So those are the sorts of health messages we’ve been getting, and that’s very simply how that relates to this value.
It’s been all over the news, as you’ll have seen. So, this is just from the 4th of June. I access to a load of news sites and looking at whether the R number is similar across the U.K., whether it’s got bigger than one in certain places, so it’s been a way of talking about the disease in the media. Why is that important? Well, we’ve seen that it’s related to spreads, but also it relates to how we control the disease.
Herd immunity
We also have heard talk of herd immunity and herd immunity occurs when enough of the population is immune that they’re effectively protecting susceptible individuals. So, you don’t need everybody in the population to be immune to prevent an outbreak, you just need enough people that are so that susceptible and the infected people are less likely to come into contact. When you’re looking at vaccination strategies in particular, you can use the models to determine what proportion of the population you need to vaccinate in order to achieve this herd immunity. So for measles, for example, you need a really high proportion of people immune to have been vaccinated to control the disease and to stop a big outbreak so something like 90 percent. That’s why you often hear news items about people being worried about the vaccination rates dropping because they think that will then cause an outbreak because we haven’t picked this herd immunity level in the population.
For an R of three, you need about 66 percent of the people to be immune or have been vaccinated. Now, obviously, we don’t have a vaccine, and so the other way to deal with that is to reduce the transmission by that kind of amount. In fact, on the 2nd of June, Neil Ferguson was in the news for having said that, we need to reduce that transmission by 65 percent to control the pandemic. That’s how we’ve kept R below one is that we’ve made this reduction in in transmission that’s kept R low, which is almost the equivalent of vaccinating. Either way, you have to reduce transmission enough. Again, that relates to this picture that we’ve seen around stopping onward transmission.
That is a very, very simple model. As I said before, it’s only got two elements to it. The other kinds of things that we might want to include in a model to make it more realistic (and this is what lots of people in the UK are working) include geography. Not everyone contacts everyone else. At the end of last week, people at the University of Cambridge, funded by the MRC, produced some data on the R number in different regions, and that hit the headlines because the North West, for example, has now got R greater than one according to their data. The Southwest is at one. The others have got much closer. You can see the blue lines are the rates in May – they were lower, we had got some control. You see in London, it was down to 0.4 and now it’s back up to 0.95. There’s a lot of variability in this information. It’s quite difficult to estimate, but because of the easing of lock down, it looks like in lots of areas the amount of transmissions increased, which is not entirely surprising. However, it does mean we might need to look at different geographical regions and treat some regions differently than others to try and control the disease. Again, it was on the news that in the North West it is recommended schools don’t go back, for example, because of this increase in transmission that they’ve seen as opposed to other parts of the country.
I’m not going to focus on different impacts on different ages and ethnicities, but that’s very clear and been discussed in great detail in the news. Older people are more susceptible or more heavily affected by the disease. They’re more likely to have serious symptoms and black and minority ethnic groups, again, more likely to die of disease. There’s different studies looking at how much of that is about increased contacts and how much of that is about increased susceptibility or the disease behaving differently in different people. We need to understand that to understand how to protect people properly.
Super Spreaders
What I will focus on is super spreaders, because this is a really interesting problem. This is the infection network of SARS from 2002 to 2004. That was one of the first outbreaks where we had really good data on individual transmission. What we’ve got here is transmission from person to person. So, person number one, you can see infected quite a lot of people. Then if you look at that top line going from there, they infected a person who then didn’t infect anyone else. There’s lots of people who only have one arrow coming out of them – so they either infected one extra person or you can see there’s lots of places where the disease just had died out. So, they infected no extra people. The person that’s labelled 130, for example, you can see they infected loads of people, but then lots of the people they infected did not infect anyone else or only infected one other person. So, there’s this idea that there are some individuals that infect lots of people and then most individuals only effect a small number or no one at all. These are called super spreaders.
There’s some really interesting ideas around whether that’s a super contactor (someone has lots of contacts) eg a kind of gregarious person who’s out meeting lots of people or perhaps even a hospital work or something like that who just has more contacts, or if it’s that they are biologically different in some way and shedding more virus. The picture here is Typhoid Mary. She was born in Ireland in the 1880s and she spread typhoid fever because she was asymptomatic and no one knew. So, she’s a sort of archetypal super spreader. You might shed more virus either because you’ve been exposed to more virus when you were infected, so you got a higher dose and that means you shed more. You might produce more virus just because of genetics or some biological reason that would cause you to produce more. There are examples of people having physical differences in throat shape, for example, which mean that when they cough, they expel more virus. So there’s physical, there’s biological, and then there’s contacting reasons why you might be a super spreader in general. We don’t really know what the pattern is for COVID-19.
Again, this is in the news at the moment. There’s some work that’s come out of Hong Kong which said that super spreaders are fuelling the pandemic and 20 percent of sufferers are responsible for 80 percent of transmissions as a fairly common pattern across lots of different diseases. Some other work that’s looked at whether it’s just that you can be a super spreader by happening to be around a lot of people at the time you’re at the peak of your infection. So, it’s not necessarily that you are different, but there’s been a super spreading event, which means that you were infecting lots of people just by chance. So, how we look at how super spreaders are important in the disease transmission, and whether that can guide control to make it easier, means that you can identify the sort of highest risk people or the highest risk events that would help to control the disease.
Conclusion
To conclude, R is a really simple but useful way to think about how quickly the disease is spreading, but it’s not the same in all places or for all individual people. Although we can get a big general overview by looking at the average R, we have to look at the nuance of different regions and different types of people or settings. It might be higher in care homes, for example, in order to understand how to control the disease. Focussing our control measures in the areas of greatest risk will be the best way to deal with that. That’s the most useful information it can give us.
If you want to find out more about this kind of thing, there’s a social distancing lecture by Savi Maharaj that looks at how models have been used to understand the impact of social distancing.
Thank you for listening.